
Introduction
Every serious endurance athlete has been there. Weeks of solid training, fitness climbing, workouts clicking, then suddenly the legs go flat, motivation tanks, and a race that should feel controlled becomes a sufferfest. The instinct is to blame sleep, nutrition, or stress. The real culprit is usually simpler: training load mismanagement.
Training load is the single most actionable metric in an endurance athlete's toolkit. It quantifies how much physiological stress you're accumulating, tracks how your body is adapting, and, when monitored correctly, tells you when you're building fitness and when you're digging a hole. Ignoring it is how athletes end up injured, burned out, or peaking on the wrong week.
This article breaks down what training load actually measures, how the acute-chronic workload ratio works in practice, and how to use it to stay healthy and perform when it counts.
What Training Load Actually Measures
Training load is a composite measure of training stress, how much work you did and how hard that work was. The simplest version is just volume multiplied by intensity. A 90-minute easy run and a 90-minute tempo run are not the same training load, even though they share the same duration.
Most modern training platforms quantify this using one of two frameworks:
TSS (Training Stress Score) : developed by Andrew Coggan for cycling, TSS uses power relative to functional threshold power (FTP) to calculate a numerical score for any given session. A one-hour effort at exactly threshold power equals 100 TSS. The system extends to running via pace-based equivalents (rTSS) and swimming (sTSS), making it particularly useful for triathletes.
TRIMP (Training Impulse) : an older model based on heart rate, multiplied by session duration and weighted by intensity zone. TRIMP remains widely used in academic research and in platforms that rely on heart rate rather than power.
Both systems are proxies. They estimate physiological stress rather than measuring it directly. Neither perfectly captures cumulative fatigue from heat, altitude, sleep debt, or life stress. But as planning frameworks, they're robust enough to make meaningful training decisions, provided you use them consistently.
Acute vs. Chronic Training Load: The Core Concept
The real utility of training load metrics comes from comparing two time windows: what you've done recently versus what your body is used to doing.
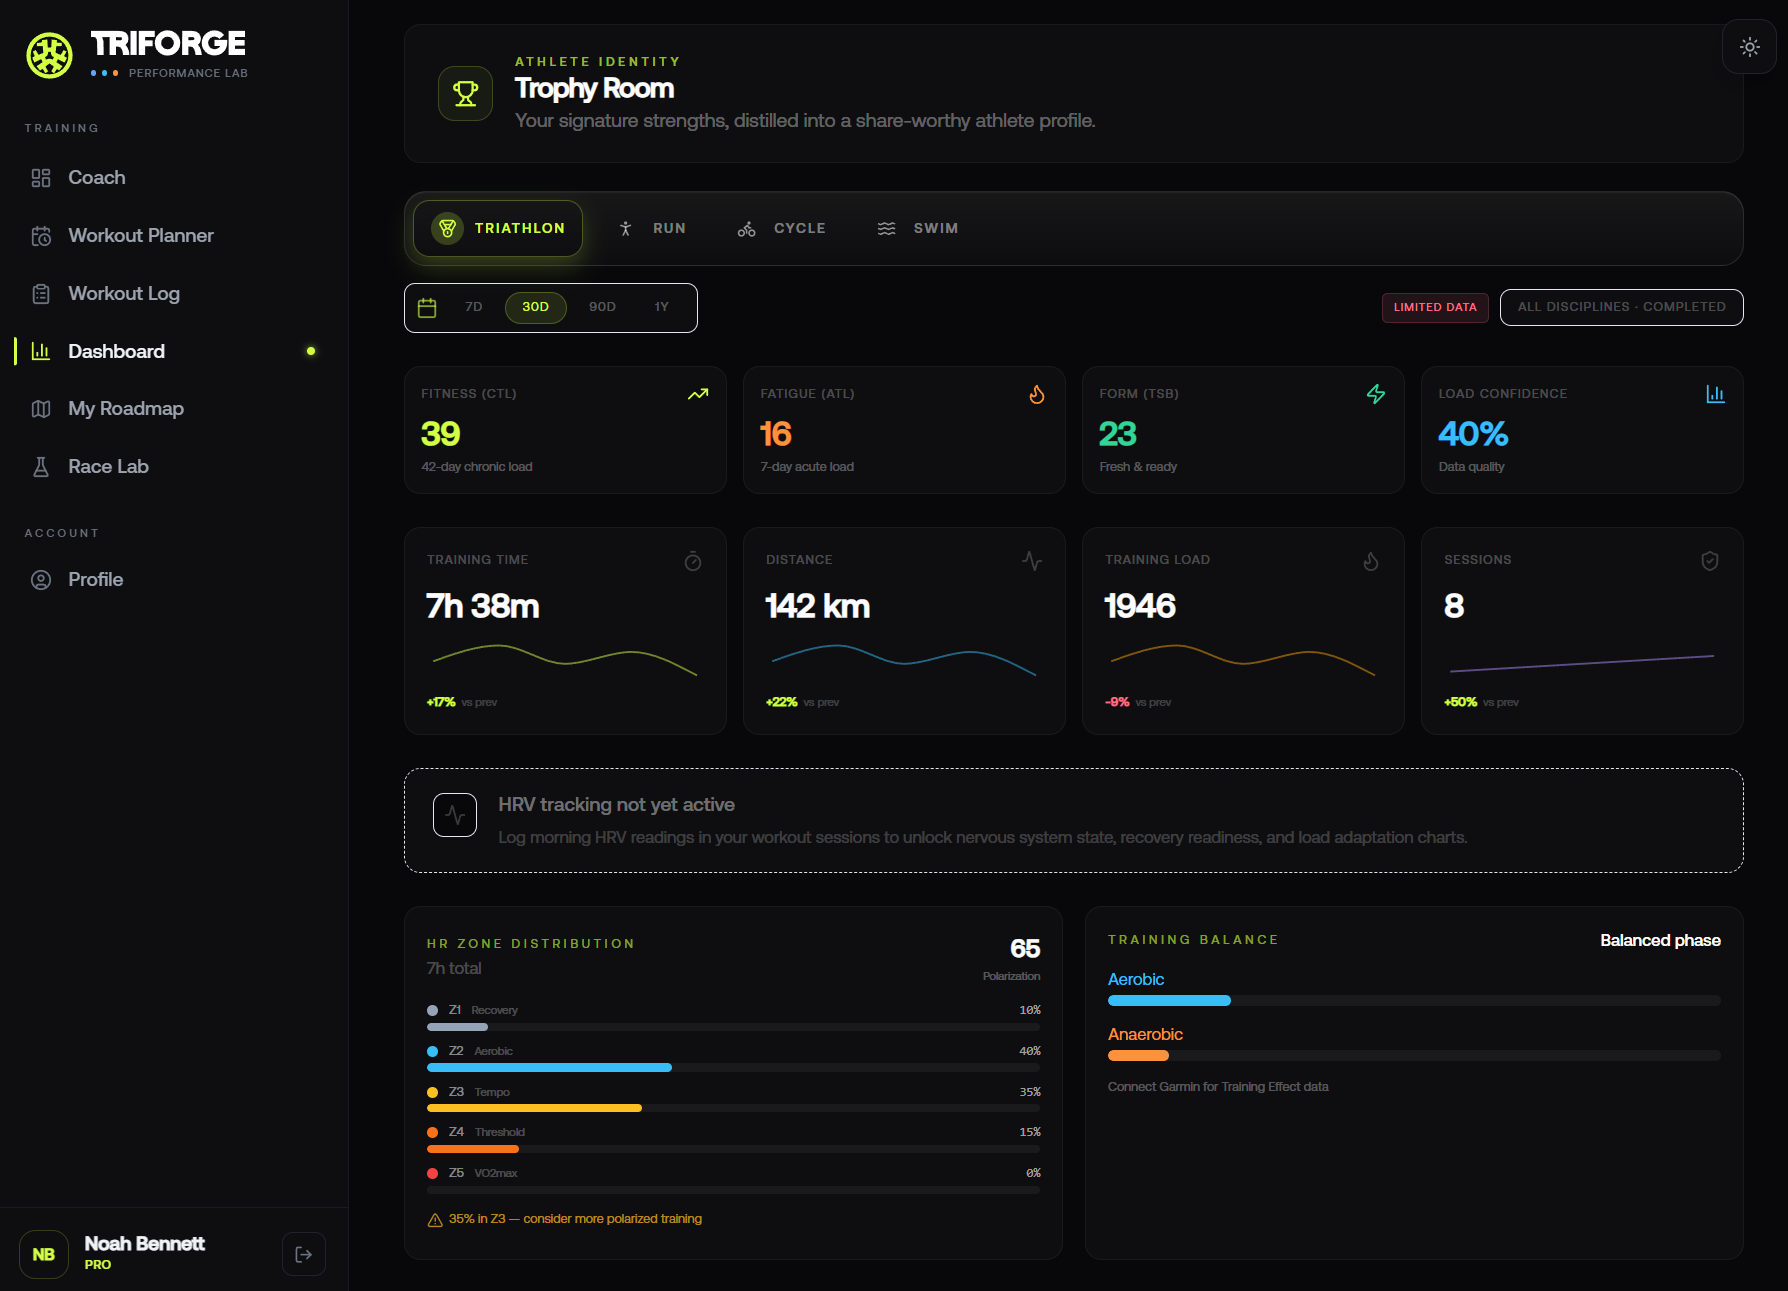
Chronic Training Load (CTL) : sometimes called "fitness" is a rolling 42-day weighted average of your daily training stress. It represents your baseline capacity: the training volume your body has adapted to absorb and recover from. CTL rises slowly, because genuine physiological adaptation takes weeks.
Acute Training Load (ATL) : sometimes called "fatigue" is a rolling 7-day weighted average. It responds quickly to recent training, spiking after hard blocks and dropping fast during recovery weeks. ATL is essentially how tired you are right now.
Training Stress Balance (TSB), or "form," is simply CTL minus ATL. When ATL exceeds CTL, when you're accumulating fatigue faster than your baseline fitness can absorb, TSB goes negative. A mildly negative TSB is normal during a build phase. A deeply negative TSB sustained for weeks is a red flag.
The goal of periodization, stripped to its essence, is to push CTL upward over a season while keeping TSB negative enough to drive adaptation but never so negative that recovery becomes impossible.
The Acute-to-Chronic Workload Ratio
The acute-to-chronic workload ratio (ACWR) is where training load monitoring becomes genuinely predictive rather than just descriptive. First popularized in team sports research, the ACWR has become a practical injury-prevention tool across endurance disciplines.
The calculation is straightforward: divide your acute load (last 7 days) by your chronic load (last 28 days). The resulting ratio indicates whether your recent training is proportionate to what your body is prepared for.
Research consistently points to a "sweet spot" ratio between roughly 0.8 and 1.3. Within this range, athletes are doing enough work to drive adaptation without outpacing their body's capacity to absorb it. Ratios below 0.8 suggest undertraining, you're not stressing the system enough to improve. Ratios above 1.5 are where injury risk climbs sharply.
The dangerous zone isn't always a single reckless week. It often accumulates gradually: a few extra sessions here, a rest day skipped there, a race sandwiched between two hard training blocks. The ACWR makes these patterns visible before they become problems.
One important caveat: the ACWR works best when training load is calculated consistently. Switching metrics mid-season, or mixing pace-based and heart rate-based scores, can produce misleading ratios. The number matters less than the consistency of how you arrive at it.
Why Athletes Get This Wrong
The most common training load mistake isn't doing too much in a single session, it's doing too much across a rolling window without realizing it.
The big-week trap. Athletes returning from illness, travel, or a forced rest period often respond by cramming in volume to "make up" for lost time. Their CTL has dropped during the break, but they train as if it hasn't. The result is an ACWR spike that the body isn't prepared for.
The monotony problem. Repeating the same moderate load week after week keeps the ACWR looking safe while actually increasing injury risk through cumulative tissue stress. Some variation in weekly load, planned hard weeks followed by easier recovery weeks, keeps the ratio healthy while preventing adaptation plateaus.
Racing as training. A long-distance triathlon or marathon isn't just a performance event, it's an enormous acute load spike. Many athletes underestimate how much a race costs them and jump back into training before ATL has come back down. The recovery week after a major race isn't optional; it's part of the training structure.
Ignoring non-sport stressors. Training load metrics don't capture the stress of a demanding work week, poor sleep, or emotional strain. Physiologically, stress is stress. A week of heavy workload on 5 hours of sleep per night is not the same as the same workload on 8 hours, even if the TSS numbers are identical. Good load management means accounting for life, not just training hours.
Practical Load Management Across a Season
Understanding the concept is one thing. Building a season structure around it is another.
Base phase. The goal is to build CTL steadily, typically no faster than 5–8 TSS points per week for most athletes. This sounds slow, but compounding over 16–20 weeks produces substantial fitness gains without accumulated breakdown. Three weeks of progressive loading followed by one recovery week (where ATL drops, TSB improves, and CTL consolidates) is a well-validated structure.
Build phase. CTL growth often plateaus here as intensity increases. Higher-intensity sessions produce more TSS per hour, which can push ATL up quickly. This is the phase where monitoring ACWR becomes most critical, the sessions feel productive, motivation is high, and it's easy to stack too much stress without noticing.
Race preparation. The taper is fundamentally a TSB recovery mechanism. As you reduce volume and ATL falls while CTL holds (or drops slightly), TSB climbs toward zero or modestly positive. Research on taper length and depth is varied, but for most long-course athletes, a 2–3 week taper with gradual volume reduction, not an abrupt cutback, produces the best results.
Off-season. CTL will drop. This is healthy and intentional. Attempting to maintain peak fitness year-round keeps ATL chronically elevated, prevents true tissue recovery, and is a fast path to burnout. A deliberate off-season drop in CTL sets the foundation for a higher ceiling the following year.
Load Monitoring Tools and Their Limitations
Several platforms now offer ATL/CTL/TSB tracking. TrainingPeaks remains the most widely used among serious age-groupers, with its Performance Management Chart giving a clean visual of all three metrics across a season. Garmin Connect, Wahoo, and others offer simplified versions. Strava's relative effort feature is more basic but accessible.
The limitation shared by all of them is that they only know what you tell them. A session that doesn't get uploaded doesn't count. A walk, a heavy gym day, or a stressful travel day is invisible to the algorithm. This is why load management is still a skill, not something an app can fully automate.
There's also an individual variation problem. The research-derived ratio thresholds, 0.8 to 1.3 as a sweet spot, above 1.5 as elevated risk, are population-level averages. Some athletes tolerate higher ACWR ratios without incident; others break down well within the "safe" range. Calibrating these benchmarks to your own history takes time and honest self-assessment.
Heart rate variability (HRV), resting heart rate trends, and subjective readiness scores are useful complements to load metrics precisely because they capture what TSS can't: how your body is actually responding. Using both together gives a more complete picture than either alone.
The Warning Signs Worth Taking Seriously
Load metrics are most valuable as early-warning systems. By the time you feel burned out or injured, the window for easy course correction has usually closed. These are the signals that warrant a training response before they escalate:
- Persistent TSB below −30 for more than two consecutive weeks without a scheduled recovery week
- ACWR above 1.4 sustained across a rolling 10-day window
- HRV trending downward while load remains constant (not just single-day variation)
- Motivation dropping noticeably not just a hard day, but a multi-day shift in willingness to train
- Performance regression in sessions where effort is controlled and conditions are normal
Any two of these occurring simultaneously is a strong signal to take an unplanned recovery day or easy week, regardless of where you are in the training plan.
How Triforge Helps
Managing training load across three disciplines, swimming, cycling, and running, adds a layer of complexity that single-sport tools weren't built for. Triforge is designed to handle exactly this. The platform aggregates load across all modalities via Strava integration, giving you a unified view of your acute and chronic training stress rather than fragmented numbers in three separate apps. Its adaptive coaching engine uses your real training data to flag when your workload ratio is drifting into risky territory, and adjusts upcoming sessions accordingly, pulling back intensity before you dig a hole, not after. For athletes who want to train hard and race well without the guesswork of manual load calculations, Triforge makes the science actionable.
Ready to stop guessing and start training with purpose? Triforge connects to your Strava data and builds a training load picture across swimming, cycling, and running, so you always know where you stand before the wheels come off.